
Downside short term risk in equity markets currently exceeds short term upside potential. More sectors are starting to roll over from overbought levels. Fourth quarter earnings reports, economic news and possible macro events point to the high probability of at least a shallow, short term correction. Short term weakness will provide an opportunity to enter into seasonal plays that traditionally outperform during the spring season (e.g. Energy).
Equity Trends
Editor’s Comment: No question! Response to the U.S. employment report released on Friday was a surprise. Validity of the report is questionable, but the response was real. However, strength on Friday only pushed technical indicators to a greater short term overbought level. Regrettably, Tech Talk missed most of that gain, but the gain does not change the strategy on North America equity markets.
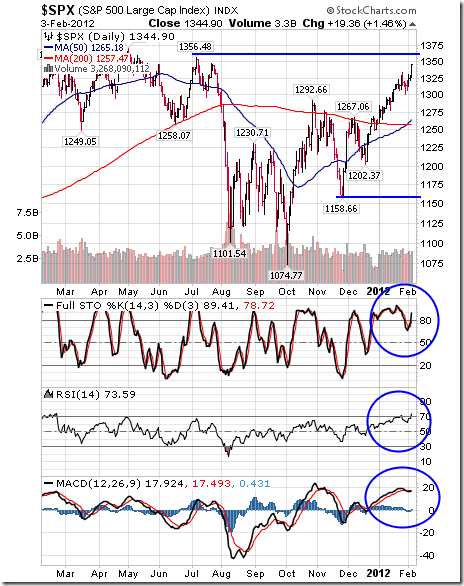
The S&P 500 Index gained 28.58 points (2.17%) last week. Intermediate trend is up. Support is at 1,158.66. Next resistance is at 1,356.48. The Index remains above its 50 and 200 day moving averages. It completed a “Golden Cross” last week. Short term momentum indicators are overbought and showing early signs of rolling over. Strength on Friday on news of the employment report was a surprise, but only caused the chart to become more overbought.
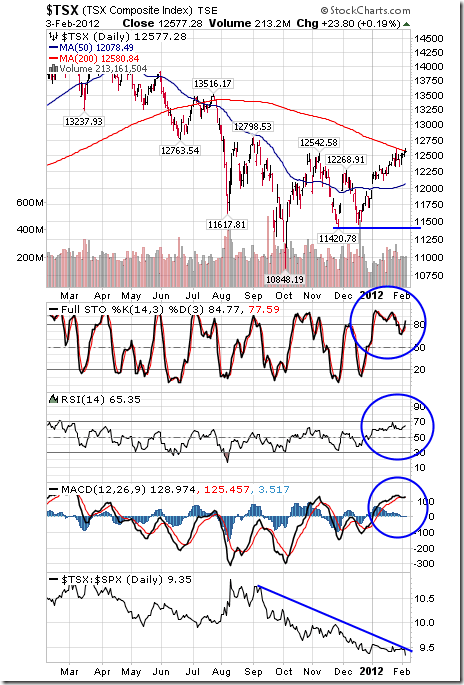
The TSX Composite Index gained110.78 points (0.89%) last week. Intermediate trend is up. Support is at 11,420.78 and next resistance is at 12,789.53. The Index trades above its 50 day moving average and trades at its 200 day moving average. Short term momentum indicators are overbought and showing early signs of peaking. Strength relative to the S&P 500 Index remains negative.
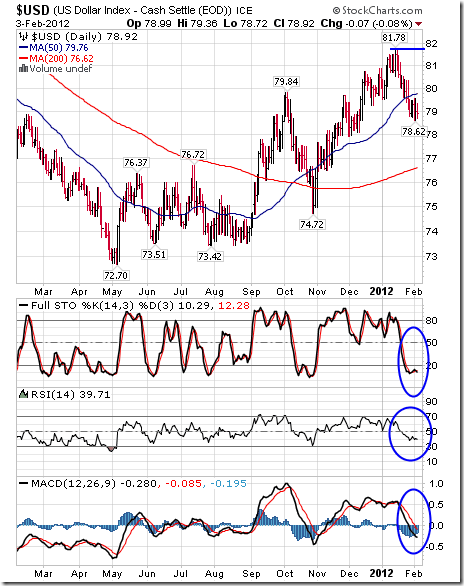
The U.S.Dollar Index was virtually unchanged last week (up 0.02). Intermediate trend is up. Support is at 74.72 and resistance is at 81.78. The Index remains below its 50 day moving average. Short term momentum indicators are oversold, but have yet to show signs of bottoming.
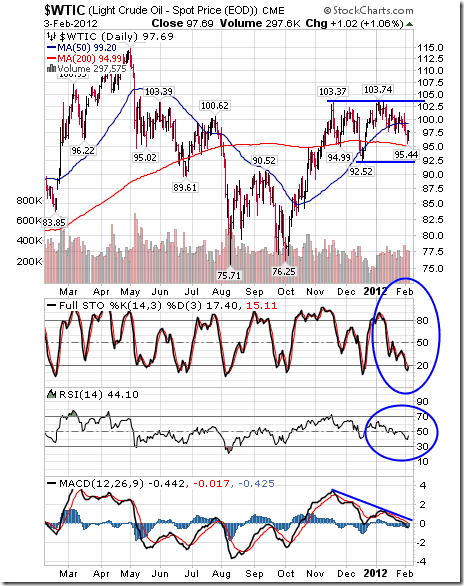
Crude Oil fell $2.07 per barrel (2.07%) last week. Intermediate trend is up. Support is at $92.52 and resistance is at $103.74. Crude fell below its 50 day moving average, but remains above its 200 day moving average. Short term momentum indicators are oversold, but have yet to show signs of bottoming. Seasonal influences turn positive in mid-February.
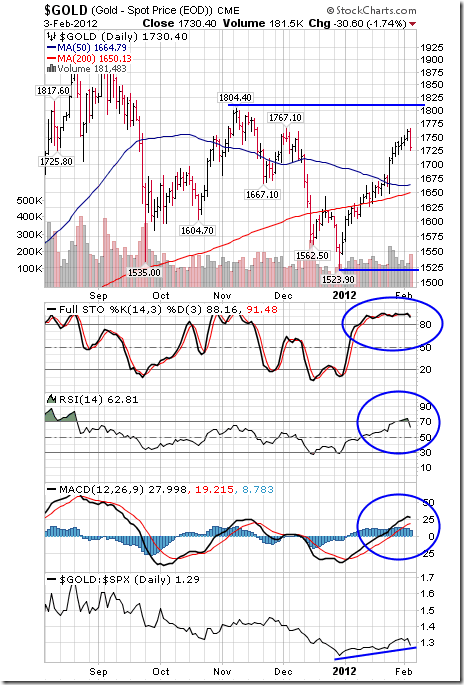
Gold slipped $3.10 (0.18%) last week. Notice the Leibovit volume reversal on Friday. Short term momentum indicators are overbought. Stochastics recorded a short term sell signal Friday. Strength relative to the S&P 500 was positive until Friday. A correction to its 50 and 200 day moving averages is possible.
….so much more over at Don’t Monday Morning Site HERE