

Interest Rate Spread Between BoC Bank Rate Less the Posted
5yr Fixed Mortgage and CPI, Real Bank Rate & TSX RE Index
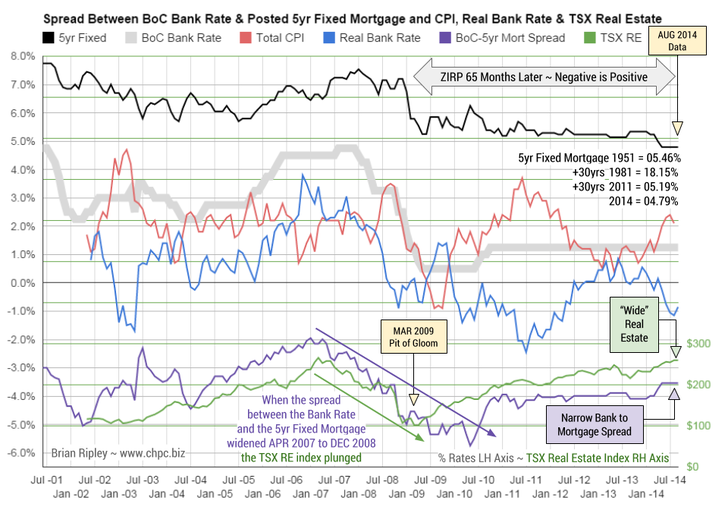
The chart above shows that in Augusst 2014 the spread between the Canadian Bank Rate (1.25%) and the posted residential 5 year fixed mortgage (4.79%) remained at its narrowest (3.54%) since the Aug-Sept 2008 spread of 3.6% which did not augur well that fateful autumn.
The continuing zoom in CPI (now 2.1%) is pushing the real Bank Rate deeper into a negative return. The trend is egging on the search for yield while promoting excessive margin debt as preferred lenders tout their lowest rates sweeping risk perceptions under the rug and governors finger wag the consumer class to spend more without increasing leverage.
The top 10% of earners need little incentive to chase capital gains, and the big national Canadian banks don’t need much in the way of a vigorish on high ratio tax payer insured loans; they can unload the narrow spread “conventional” paper to the securitized derivative markets, (CMBs, REITs) to avoid the risk of holding to term when comparative rates could be higher; or the collateral value lower.
A mortgage interest rate “sale” gets new customers and their deposits, accounts, investments and insurance business AND 80%+ customer retention into the subsequent term renewals on a slam dunk bet that rates will be higher off of current fire sale lows (my branch advertises sub 3% for a 5 year fixed). If there was a 30 year cycle of mortgage rates, it’s broken now with the current leg extending into 33 years.
When the spread between the BoC Bank Rate and the 5 year retail mortgage rate widened from April 2007 to Dec 2008, the TSX Real Estate Index rolled over and plunged into the March 2009 pit of gloom.
My case study of what a Vancouver investor is facing when contemplating the purchase of an average condo for the purpose of rental revenue demonstrates that although interest rates may be low, the capital cost according to my case study is 25% too high. If borrowing costs rise even fractionally the incentive to hold is irrational.
“Real Interest Rates” (BoC Bank Rate & 30yr Bond Rate less
CPI) and TSX Real Estate Index
Real Rates of return fall with the rise in CPI or the drop in nominal yields.
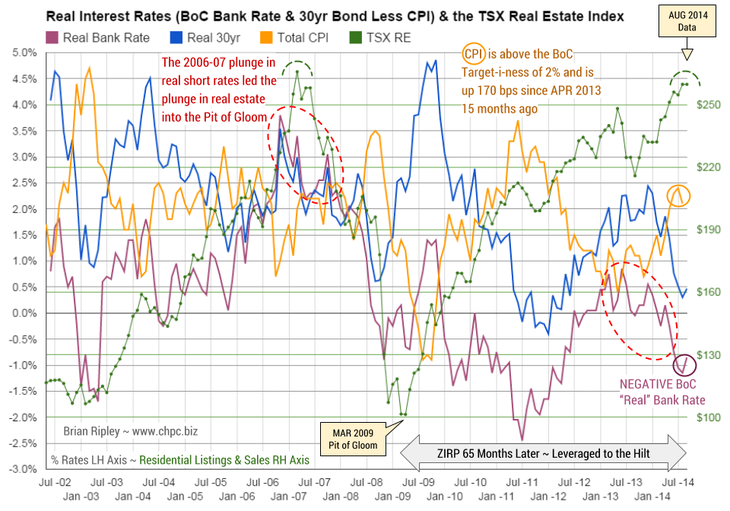
The chart above shows that in August 2014 real interest rates as defined by the nominal rate less CPI took a rest from plunging with the CPI ticking back down to 2.1%. It was 2.5% in Jan-2012 and 2.3% in April 2012 which was the peak in averageVancouver SFD prices.
The CPI inflation stoked by a weak CAD/USD is increasing the cost of stuff we import which is showing up in the CAD Canadian Commodities Index that is recently returning back down to trend. The cost of stuff is still dampening real investment returns by increasing the holding cost of the asset. But cash buyers of the TSX real estate index have only been targeting the 2007 peak and the current spike is hitting a late season ceiling.
The Real Prices Chart shows the “real” price of real estate (Vancouver, Calgary, Toronto average SFD prices) held in check below the 2012 highs despite the aggressive bidding up of nominal prices and the fire sale peddling of credit.
CPI is now 170 beeps off the April 2013 low and at 2.1% qualifies as over reaching the Bank of Canada’s target-i-ness.
The renewed erosion of yield may produce a hike in the Bank of Canada rate and mortgage rates sooner rather than later although BoC head Mr Poloz says there is no rush to raise the Bank Rate; he sees “…too many economic risks, including low inflation, sputtering exports, a shaky housing market and a raft of global uncertainties from Ukraine to China” (Globe & Mail April 16, 2014).
Ah shucks, maybe he is just talking global central bankerese about employing negative interest rates to combat hoarding (CBC News June 5, 2014).