
Wealth Building Strategies
“I have been impressed with the urgency of doing. Knowing is not enough; we must apply. Being willing is not enough; we must do.” -– Leonardo da Vinci
Others seem to languish. They have the ‘right’ degrees, and seem to have all the right answers and have all the trappings of success, but they really do not seem to achieve much. It’s all talk, talk, talk! . However, look behind the veneer and it is all talk!
I believe the difference is action!
Talk is cheap, while action is priceless. The difference between these two types of people is that the talker is busy describing what he plans to do, while the action taker is busy actually doing it.
Nothing happens without action. Action is like the fuel in an engine. An engine can have lots of potential energy but can only be turned into kinetic energy and forward movement once fuel is added. Without fuel, it will sit there, looking pretty for a while but eventually, all the other cars will pass it and it will slowly rust away. Action is the fuel of everyday living.
We human beings are kinetic – we are literally built to move! Every fiber in our body, every sinew, every organ and every one of our senses is designed to make us a living, moving, action oriented being designed to achieve things. This is the natural state of affairs. Inaction goes against everything we are designed to do.
It may feel strange at first, particularly if you are overly concerned by the opinions of others. However, over time, becoming a person of action will align your mind and body, causing great energy and courage to spring forward, moving you to great heights of achievement and fulfillment.
Why is action so important?
Firstly, action is the only way anything gets done. Quite simply, nothing else can move the needle at get you closer to your goal than action. Action is the critical path item necessary to accomplish great goals.
Secondly, action helps overcome fear. You have probably heard the expression of being ‘frozen by fear’. It is very true if you have ever been in an emergency situation or under extreme pressure, there is a tendency to freeze up. Actions, however small, releases us from the fear, gets our mind and body moving, and moves us into a new and positive state.
Thirdly, action creates momentum. It literally gets the ball rolling. Have you ever noticed how one little action can open up the floodgates, it can be a catalyst for doing something great. A well-placed phone call starts a sales process going. The road to financial freedom can be signing up for one seminar. Weight loss program can start with a single walk around the block. Action gets things going.
Fourthly, action provides feedback and makes things better. We can theorize all day about the consequences of doing something, but we really don’t know until we try. Action is a feedback and self-correcting mechanism. For instance, say you wanted to buy your first home and study all the right books and look at lots of listings. If you want to get a very quick and clear sense of buying a home, then take the action of making an offer. You may not get the home, but you can learn from it and try again, this time better informed and more experienced. You learn 80% of what you need to know the first time you do something and then spend the rest of your life learning the other 20%
Finally. Action is empowering. It literally moves the power from someone or something else to you. When you are being acted upon, you are out of control and can become a victim. By taking action, however small, you move the power back to yourself and therefore, control your own destiny.
Action is the one way to truly express yourself and your gifts. If you don’t take action the world, family, friends and external circumstances will define you and you will not achieve your full human potential. Action, in a positive, enlightened and worthwhile form is the one way to show yourself, God and the world what you are truly made of, what you can accomplish and what you did during this short time we have on earth.
10 Steps on how to become a Relentless Action Taker:
- Make it a habit by taking daily, regular and consistent actions.
- For small decisions, don’t over analyze. Decide immediately and move on quickly.
- For large decisions, set a deadline, make an action plan and start immediately.
- Complete something each day that you have been putting off.
- When very fearful, take an action, particularly one requires physical movement to get started.
- Avoid telling people what you plan to do, impress with results not talk.
- If an action does not pan out, seek the learning from it, course correct and act again.
- Focus your actions on high value, productive activities, while avoiding time-consuming people and activities.
- Don’t confuse activity or being busy with productive action that moves you forward towards a worthwhile goal.
- Avoid analysis paralysis; gather sufficient information and then act
…also from Eamonn Percy:

Are you among those who believe that index funds/ETFs have proven themselves to be better performers than managed funds?
Like any in debate in which actual factual data can be examined to either help prove or disprove something, in the following article, extensive comparative performance results will be presented that will be hard for people who believe in the presumed inferiority of managed funds to explain. In fact, the results presented below, upon careful consideration, should be regarded as perhaps game-changing to what many investors have come to believe. So let’s jump right into this data.
If index funds are superior performers to managed funds, the average mutual fund which includes all diversified funds should, when examined over a long period, obviously tend to do more poorly performance-wise. So is this true?
While I can’t examine all index funds, I selected two of the most popular ones, the Vanguard Total Stock Market Index (VTSMX) which represents the entire US stock market, and the Vanguard Total International Stock Index (VGTSX) which represents the entire rest of the world excluding US stocks. In fact, most other broad stock market index funds as well as ETFs should achieve just about the same performance results, less very minor difference in expense ratios.
On the other hand, there is available published data on the average performance of all diversified US stock funds as well as all International (non-US) stock funds. This data is published monthly in the Wall Street Journal.
By comparing the returns of each of these two index funds with the returns of the average US and International fund, one can determine, over the course of any given year, which did better, the index or the average of all similar types of funds.
To prove the superiority of index funds, one would expect to see a pattern of better performance vs. the average fund of its comparable type.
But, to be convincing, such comparisons, would need to encompass a long stretch of time. This is because while one measure might be superior for a relatively short number of years, the other might be superior over another stretch. With that in mind, examine the following:
Comparing Yearly Broad US Stock Market Index Performance with That of Average US Diversified Fund
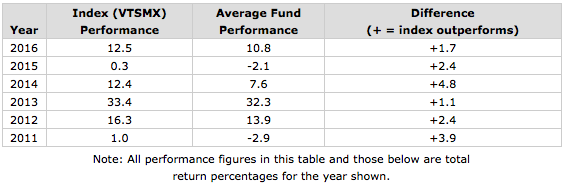
Indeed, each year between 2011 and 2016, the US stock index fund did consistently better than the average US stock fund. The average difference was +2.7%. Given this wide degree of outperformance for the index, it starts to become understandable why many investors are now convinced that index funds are clearly superior in performance to the average fund, many of which are managed funds, not passive indexes.
But data from the past six years alone are not sufficient to conclude that an index fund will almost always come out ahead over other time periods. If we examine the same data going further back to 2000, we find a somewhat different pattern, with the average fund actually coming out a little ahead of the index, although on an irregular basis depending on the specific year. In this period from 2000 to 2010, encompassing 11 years, the index fund comes out behind the average fund by an average of -0.8% per year. The following table shows the comparisons:
| Year | Index (VTSMX) Performance |
Average Fund Performance |
Difference (+ = index outperforms) (- = average fund outperforms) (0 = neither measure outperforms) |
| 2010 | 17.1 | 17.1 | 0 |
| 2009 | 28.7 | 32.0 | -3.3 |
| 2008 | -37.0 | -38.7 | +1.7 |
| 2007 | 5.5 | 6.6 | -1.1 |
| 2006 | 15.5 | 12.6 | +2.9 |
| 2005 | 6 | 6.7 | -0.7 |
| 2004 | 12.5 | 12 | +0.5 |
| 2003 | 31.4 | 32.4 | -1.0 |
| 2002 | -21 | -22.4 | +1.4 |
| 2001 | -11 | -10.9 | -0.1 |
| 2000 | -10.6 | -1.7 | -8.9 |
What this appears to suggest is that outperformance by a broad index may be cyclical, that is, the index may excel over some years, or even over a number of years running, but one can hardly assume that the index won’t underperform the average return of diversified funds for a number of years either.
Nevertheless, if one averages the differences over the entire 17 year period, the index fund still comes out ahead of the average fund by +0.5%. For advocates of index funds, this is just what they would expect. However, the relatively small margin of difference tells us that the result should be considered as entirely predictable, considering that the average fund charges quite a bit more than the index, accounting for all of the difference and even more. So, no real surprise here yet.
How much more does the average fund charge? According to a recent Morningstar article, the average most apparent cost, that is, the expense ratio, across all funds was about 1.2% in 2014, although higher in earlier years. The most recent cost of VTSMX is less than 0.2%. Thus, one is looking, at a very minimum, at about a 1% difference. Additionally, there likely will be another hidden cost within managed funds, namely the trading commissions whenever a fund manager buys or sells. Also excluded are instances if a managed fund charges an initial cost (load) when you buy or sell that fund.
Therefore, were it not for these higher costs subtracted from the average fund’s pre-expense performance, the average fund might have actually beaten the index by a minimum of approximately 0.5% per year. In other words, it appears that, on average, the average mutual fund would clearly be as good or better in picking stocks than a broad market index except for the extra drag caused by the higher expenses. This could, incidentally, help to dispel the notion that the average fund manager, in spite of his presumed expertise, is actually a worse selector of stocks than those in the passive index.
Unfortunately though, these expenses do exist for the “average” fund, and at least for the above comparisons, we must declare the index fund the winner. I also found similar results when comparing the performance of the Vanguard Total International Stock Index (VGTSX) with that of the average International stock fund, with some small variations. (These results will be reported at the end of this article.)
Now that the above data appear to have made a pretty convincing case for index funds giving better end results than managed funds, I will now present data that can lead to a very different conclusion.
How can this be? If one can identify managed mutual funds whose expense ratios (and possibly, other costs) are significantly less than the above average 1.2%, they, as shown by the above 17 years worth of data, should have a good chance of beating the passively managed broad indexes. So, for example, if the above data are indeed representative, by merely choosing managed funds that chop this average expense ratio in half (to 0.60), such funds, on average, should be able to beat the index, erasing the average 0.5 deficit.
These days such lower cost managed funds are not that hard to find. At least several fund companies have good lineups of funds with a much lower than average expense ratio. For example, Vanguard is well known not only for its low-cost index funds and ETFs, but for its nearly as low cost managed funds.
So how much better can low cost managed funds do than the above two index funds? While obviously not all low cost managed funds will do better than the index, Vanguard funds have a long-standing reputation for being excellent choices.
To answer this question, I searched the complete lineup of Vanguard managed funds to find all those that have been around since at least the start of 2000. There were 20 such funds. (Note: Just one generally available stock fund shut down over this period, which if excluded due to poor performance, might make the results for the remaining funds look better. However, the shutdown was due to other factors, not poor performance.) I then researched the yearly average performance of each of these funds and compared each to the yearly average performance of either VTSMX or VGTSX, depending on whether the particular fund’s main focus was domestic or international stocks. The following table shows the results:
Comparing Average Yearly Performance Returns for Vanguard Managed Funds Vs. Those of US or International Index Funds
| Fund Name (Symbol) (US) = US Focus (I) = International Focus |
Average Yearly Performance |
Current Expense Ratio |
Average Difference Per Year (+ = managed fund outperforms) (- = index fund outperforms) |
| Energy (VGENX) (US) | 13.55 | .37 | +6.90 |
| Precious Metals and Mining (VGPMX) (I) | 13.19 | .35 | +8.12 |
| Health Care (VGHCX) (US) | 12.92 | .36 | +6.27 |
| Selected Value (VASVX) (US) | 12.06 | .39 | +5.41 |
| Capital Opportunity (VHCOX)* (US) | 11.49 | .45 | +4.84 |
| Strategic Equity (VSEQX) (US) | 11.15 | .21 | +4.50 |
| International Explorer (VINEX) (I) | 9.50 | .42 | +4.43 |
| Explorer (VEXPX) (US) | 9.41 | .49 | +2.76 |
| PRIMECAP (VPMCX) (US) | 9.12 | .40 | +2.47 |
| Global Equity (VHGEX) (I) | 9.03 | .57 | +3.96 |
| Windsor (VWNDX) (US) | 9.01 | .39 | +2.36 |
| Equity Income (VEIPX) (US) | 8.60 | .26 | +1.85 |
| Windsor II (VWNFX) (US) | 8.53 | .34 | +1.88 |
| Mid-Cap Growth (VMGRX) (US) | 7.89 | .43 | +1.24 |
| Dividend Growth (VDIGX)* (US) | 7.52 | .33 | +0.87 |
| Morgan Growth (VMRGX)* (US) | 6.34 | .40 | -0.31 |
| International Value (VTRIX) (I) | 6.09 | .46 | +1.02 |
| International Growth (VWIGX) (I) | 6.01 | .46 | +0.94 |
| Growth and Income (VQNPX) (US) | 5.93 | .34 | -0.72 |
| U.S. Growth (VWUSX) (US) | 3.02 | .46 | -3.63 |
Now, here are the same results for the above two Vanguard index funds
| Fund Name (Symbol) |
Average Yearly Performance |
Current Expense Ratio |
| Total Stock Market Index (VTSMX) | 6.65 | .16 |
| Total International Stock Index (VGTSX) | 5.07 | .19 |
As you can see in the last column of the bigger table, 17 out of the 20 managed funds delivered better 1 year average performance than the appropriate broad market index. The average per year better performance was 2.76%. You can observe that the 20 funds included three funds that were not diversified across the broad market, so-called sector funds; these funds proved to have the best average yearly performance of the 20. Therefore, to beat the indexes to this degree, one would have needed to select not just the typical diversified types of funds, but also included some other relatively low cost funds within the Vanguard lineup that would not at all closely reflect the entire market as the indexes did.
Just in case you’re wondering whether the above results would remain valid if one merely considered the average annualized returns over the entire 17 year period instead of averaging each fund’s one year returns over 17 yearly periods, data shows that the answer is emphatically yes. According to that analysis, the entire 20 funds averaged an annual return of 7.16%, beating the “buy and hold” annualized returns of VTSMX at 4.92% and VGTSX at 2.72%. The analysis of 20 funds over 17 separate time periods involved 340 separate data points, highly unlikely to introduce chance into the result vs. analyzing just 20 data points when using just the 17 year total return. And, additionally, while most investors undoubtedly don’t hold most of their funds for an uninterrupted 17 years, most will eventually drop underperforming managed funds out of their portfolio, likely making the one-year start and stop points more realistic.
Comparing Yearly Broad International Stock Market Index Performance with That of Average International Fund
Here are the International stock fund results mentioned above:
| Year | Index (VGTSX) Performance |
Average Fund Performance |
Difference (+ = index outperforms) (- = average fund outperforms) |
| 2016 | 4.7 | 0.7 | +4.0 |
| 2015 | -4.4 | -1.3 | -3.1 |
| 2014 | -4.2 | -5.0 | +0.8 |
| 2013 | 15.0 | 19.6 | -4.6 |
| 2012 | 18.1 | 17.7 | +0.4 |
| 2011 | -14.6 | -13.4 | -1.2 |
The table shows that over the last 6 calendar years, it was the index fund that has underperformedthe average International stock fund on average by 0.6% per year.
However, as shown below, for the 11 yearly periods between 2000 and 2010, the average International fund did very frequently underperform the index fund; the average yearly shortfall was 1.9%.
| Year | Index (VGTSX) Performance |
Average Fund Performance |
Difference (+ = index outperforms) (- = average fund outperforms) (0 = neither measure outperforms) |
| 2010 | 11.1 | 10.7 | +0.4 |
| 2009 | 36.7 | 32.7 | +4.0 |
| 2008 | -44.1 | -44.2 | -0.1 |
| 2007 | 15.5 | 12.4 | +3.1 |
| 2006 | 26.6 | 24.9 | +1.7 |
| 2005 | 15.6 | 14.7 | +0.9 |
| 2004 | 20.8 | 18.1 | +2.7 |
| 2003 | 40.3 | 34.7 | +5.6 |
| 2002 | -15.1 | -16.2 | +1.1 |
| 2001 | -20.2 | -21.7 | +1.5 |
| 2000 | -15.6 | -15.6 | 0 |
Over the entire 17 yearly periods, the International index fund came out beating the average International fund by 1.0%. However, as with the US focused funds above, the difference was not a surprise considering that the average fund charges quite a bit more than the index. (According to data from Morningstar, the average International fund charges an expense ratio that is about 0.2 more than domestic funds, or about 1.4% in 2014, and even higher in earlier years).
Therefore, a well-established, managed, internationally focused fund which charges considerably less than 1.4%, such as the five such funds included in the 20 listed above, should have a reasonable chance to come out as well as, or ahead of, the International index fund, assuming the above results are at all representative of many years of comparisons. Specifically, the five averaged a yearly average return of 8.8% vs. the yearly average of 5.1% for the index fund.

 When you’re in your 20s, it might seem like you have plenty of time to save and invest. But time is more fleeting than you think. Building wealth when you’re paying off student loan debt or starting a career isn’t easy, but it’ll be worth the effort later on. If you’re ready to buckle down and increase your net worth, here are seven things to do before you turn 30.
….related:
 2017 will be a year for the history books. Are you ready?
The main event will start on Friday, January 20th, when President-Elect Donald Trump is inaugurated as the 45th President of The United States of America. On that day, the status quo of the US political and economic landscape will end as the world enters a new era of Trump turbulence. Canada will not be immune. As usual, the prudent business owner, manager or entrepreneur expects the unexpected and will be fully prepared for the inevitable coming shocks (and opportunity).
In the early 1980s, when I was starting my own business career, there were similar dramatic political and economic changes. Canada was faced with an economic crisis as inflation peaked at 12% and interest rates at more than 21% in late 1981. With the economy stalled, it took several years of strong economic medicine, largely from south of the border, before economic growth took hold and prosperity returned.
Personally, I was struggling through this turbulence to stay afloat, establish my career and get traction. However, as the economy improved (along with my career) into the late 1980s, the 1990s and then the 2000s, I started to notice a persistent trend. The problems and turbulence never really stopped. There was always something: a dot-com meltdown, 9/11 terrorist attack, political turmoil or oil price crash. In business, as in my life, the problems kept coming. The only thing I could control was my response to the problems.
With this realization, early on I started to adopt a philosophy of incremental improvement in order to adapt to the changing world, rather than being engulfed by it. Each day I would focus on being a bit better than the day before and adjust my approach to the circumstances directly in front of me. This would insulate me from the inevitable shocks. While I was occasionally buffeted and bruised, I was never wiped out. I always progressed forward. This strategy worked well as I built a very successful career in turning around companies and helping entrepreneurs launch and build new ones.
Several years ago, I decided to document this approach in a simple letter to my eldest daughter (who was leaving home for university) and receptive to my input. However, I got carried away and before I knew it I had written a 370-page book on how to use the compounding power of good habits to persevere and then succeed!
So, in early 2017, as my way of giving back and helping people adapt better, I released my book called The 1% Solution: How Small Daily Improvements Produce Massive Long-term Results (now available on Amazon.com). In it, I put everything I learned from my business career since the early 1980s on how to build the habits and disciplines necessary to persevere over setbacks and achieve big goals. It has 13 chapters (each representing a theme of personal growth), 100 daily habits for improved discipline, 102 motivational quotes, 77 quote author profiles, 13 sets of self-reflection questions, and literally 100s and 100s of tips and tactics to persevere. I put all my best ideas into The 1% Solution and kept the price reasonable so I could make it accessible to as many people as possible, in order to help them on their journey, just as I was helped on mine.
By the end of 2017, the world will be a different place, and dramatically different again in 8 years. If you strip out the emotion of US politics and focus on how you can prepare yourself, your family and your business for the coming changes, which will include tremendous opportunity as well as challenges, then you will be among a small and select group of business leaders who ultimately thrive during this period by adapting to the changes and by making their world a bit better each day.
Eamonn Percy is a veteran business leader with 25 years of real-life business experience in leading and advising companies to transform and grow. He is the President of PG Capital + Business Advisors, a firm which helps businesses accelerate growth. He is a regular speaker and columnist on the topics of leadership and business. He is the author of The 1% Solution – How Small Daily Changes Produce Massive Long-term Results. (Available on Amazon.com).
 Expects dollar to continue to shine
A veteran investor, who has witnessed several crises over the past half-century, is worried.
“There is a lot of optimism,” said Jim Rogers, chairman of Rogers Holdings. “People are focusing on the good stuff when it comes to [Donald] Trump,” he said.
But there is no telling what Trump will do once in office and that unknown bothers Rodgers the most.
“He very much wants a trade war. And if that happens, sell everything,” Rogers told MarketWatch.
By everything, he means U.S. stocks, which rode Trump’s coattails to record levels following his November victory on euphoria over Trump’s promises to cut taxes, eliminate regulations and boost infrastructure spending.
…related from Michael Campbell:

-
I know Mike is a very solid investor and respect his opinions very much. So if he says pay attention to this or that - I will.
~ Dale G.
-
I've started managing my own investments so view Michael's site as a one-stop shop from which to get information and perspectives.
~ Dave E.
-
Michael offers easy reading, honest, common sense information that anyone can use in a practical manner.
~ der_al.
-
A sane voice in a scrambled investment world.
~ Ed R.
Inside Edge Pro Contributors

Greg Weldon

Josef Schachter

Tyler Bollhorn

Ryan Irvine

Paul Beattie

Martin Straith

Patrick Ceresna

Mark Leibovit

James Thorne

Victor Adair