
The January headline consumer price index (CPI) came in at 2.5%, which is near a 5-year high. What happened to deflation? As a result, real interest rates declined deeper into negative territory or in the case of the 10-year yield, went from positive to negative. No this isn’t a commodity-driven story. The core CPI (ex food and energy) has been above 2% since the end of 2015 when commodities were in the dumps. Inflation is perking up and couple that with a Fed that pursues rate hikes at a glacial speed and that is very bullish for precious metals.
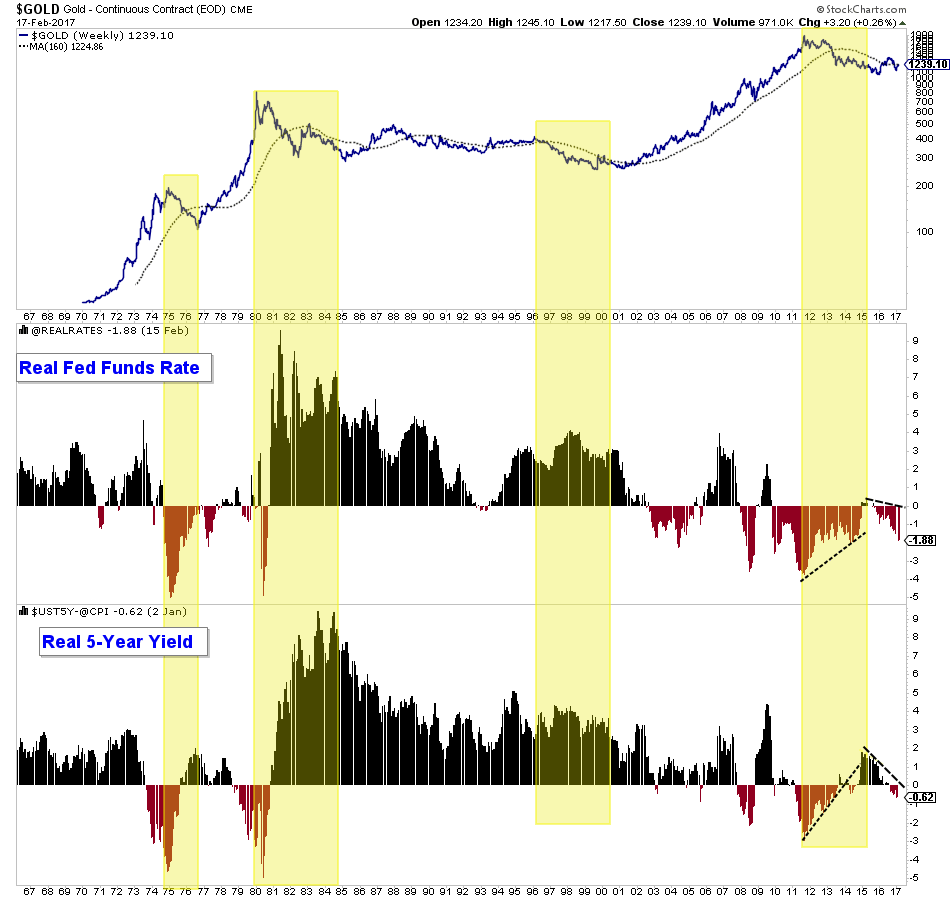
The chart below is what I refer to as our master fundamental chart for Gold. It plots Gold along with the real fed funds rate and the real 5-year yield. In short, negative and/or declining real interest rates drive bull markets in Gold while rising real rates or strongly positive real rates (like in the 1980s and 1990s) drive bear markets in Gold. Since the middle of 2015 both the real fed funds rate and the real 5-year yield have declined by +2%. The real fed funds rate has declined from a fraction above 0% to now almost -2% (-1.88%). Meanwhile, the real 5-year yield has declined by roughly 2.5% in the past two years from nearly 2% to now -0.60%.
Fundamental analysis can be backward looking and that is why it is so important to verify fundamentals through the lense of technical analysis. While there are numerous charts we could show we want to present a fresh look at some sector relationships which help confirm the strong fundamentals currently supporting the sector.
In the chart below we plot the gold stocks (both the seniors and juniors) against Gold and we plot the juniors against the seniors. During a healthy bull market in precious metals, the miners should show strength relative to the metals and secondarily, the riskier and more volatile stocks should also show relative strength. First, we note the GDX to Gold ratio appears poised to break its 10-year downtrend this year. Second, we see that the GDXJ to GDX ratio (juniors versus the seniors) is one month short of a 4-year high. 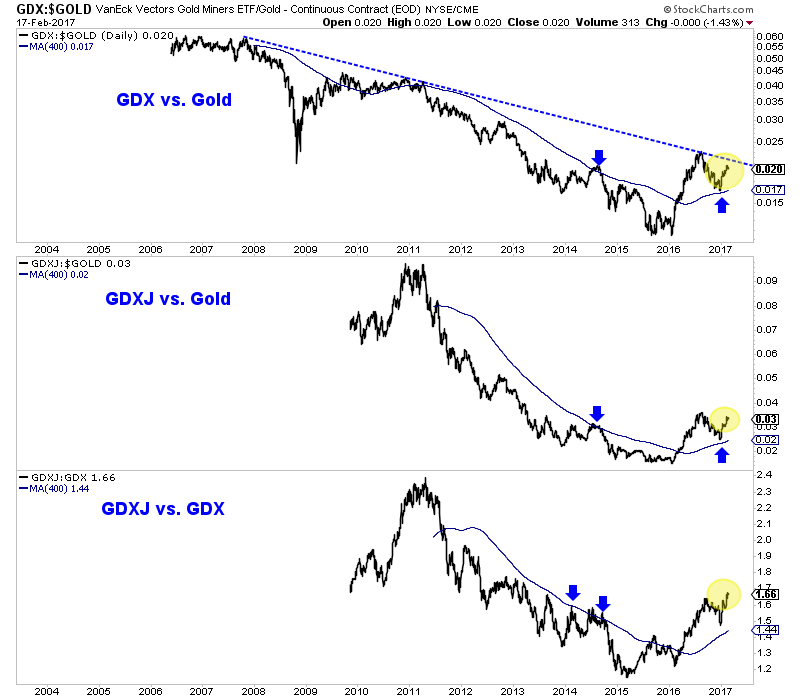
Ratio Charts
Turning to the short-term, we note that Gold successfully tested its support at $1220/oz while the miners decline on Friday suggests they may need more time to digest recent gains.
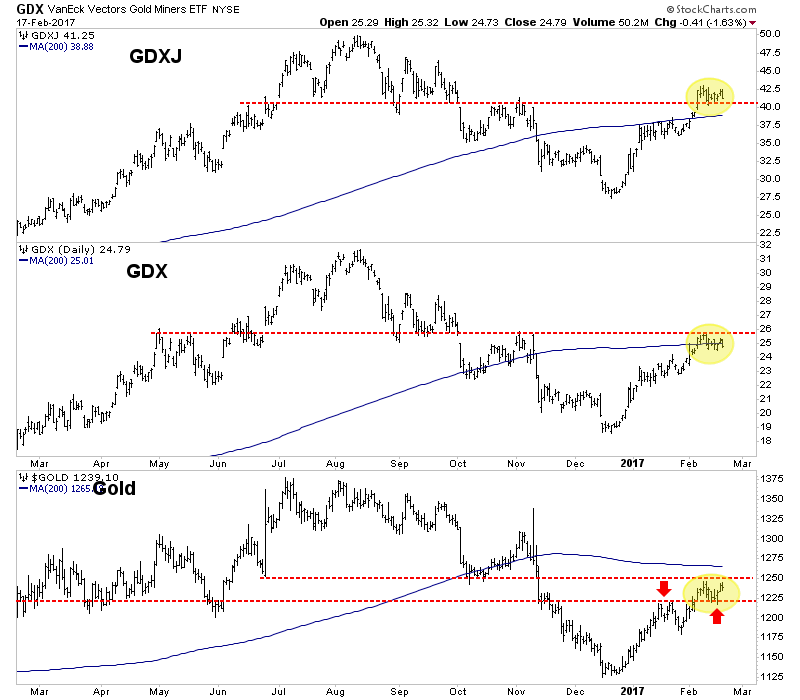
GDXJ, GDX, Gold
With negative real interest rates in place and the gold stocks trading well above their rising 400-day moving averages while showing relative strength against Gold, it is quite clear the gold stocks are in the early stages of a new bull market. It’s also difficult for us to argue that Gold and Silver are not in a bull market. The technical setup is potentially in place for the sector to make an explosive move higher over the next 9 to 18 months. Pullbacks in 2017 need to be bought due to the upside risk over the intermediate term.
Jordan Roy-Byrne CMT, MFTA