


The chart above shows the average detached housing prices for Vancouver*, Calgary, Edmonton, Toronto*, Ottawa* and Montréal* (the six Canadian cities with over a million people each) as well as the average of the sum of Vancouver, Calgary and Toronto condo (apartment) prices on the left axis. On the right axis is the seasonally adjusted annualized rate (SAAR) of MLS® Residential Sales across Canada (one month lag).
….for larger chart and analysis go HERE
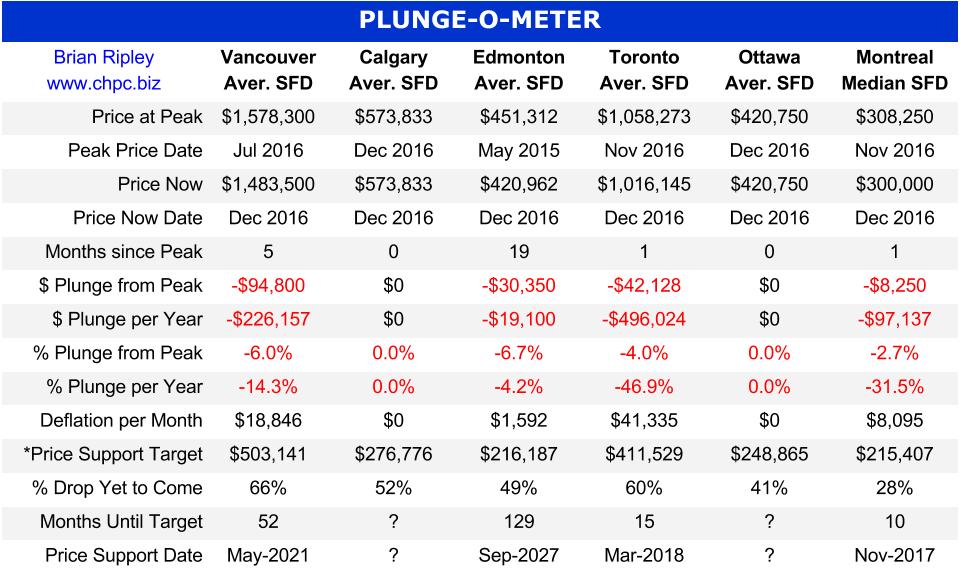
The Canadian Real Estate PLUNGE-O-METER
The Plunge-O-Meter tracks the dollar and percentage losses from the peak and projects when prices might find support. On the price chart in the spring of 2005 there was a 4-6 month plateau period while buyers and sellers twitched like a herd. When the credit spreads narrowed and the yield curve began its journey towards inversion, the commodity stampede began.
*The Price Support target represents prices at March 2005; the start of a 40 month period of ardent speculation in all commodities; then a full blown crash into the pit of gloom (March 2009); and then another 39 month rocket ship to the moon but then the crowd suddenly thinned out in April 2012. The revival of spirits erupted in 2013 as global money went short cash and long real estate on an inflation bet. Now we have a major sense of doubt about value in Vancouver and Toronto as sales and prices chill out as we move into 1Q 2017.
…for CDN Housing Priced in US Dollar go HERE