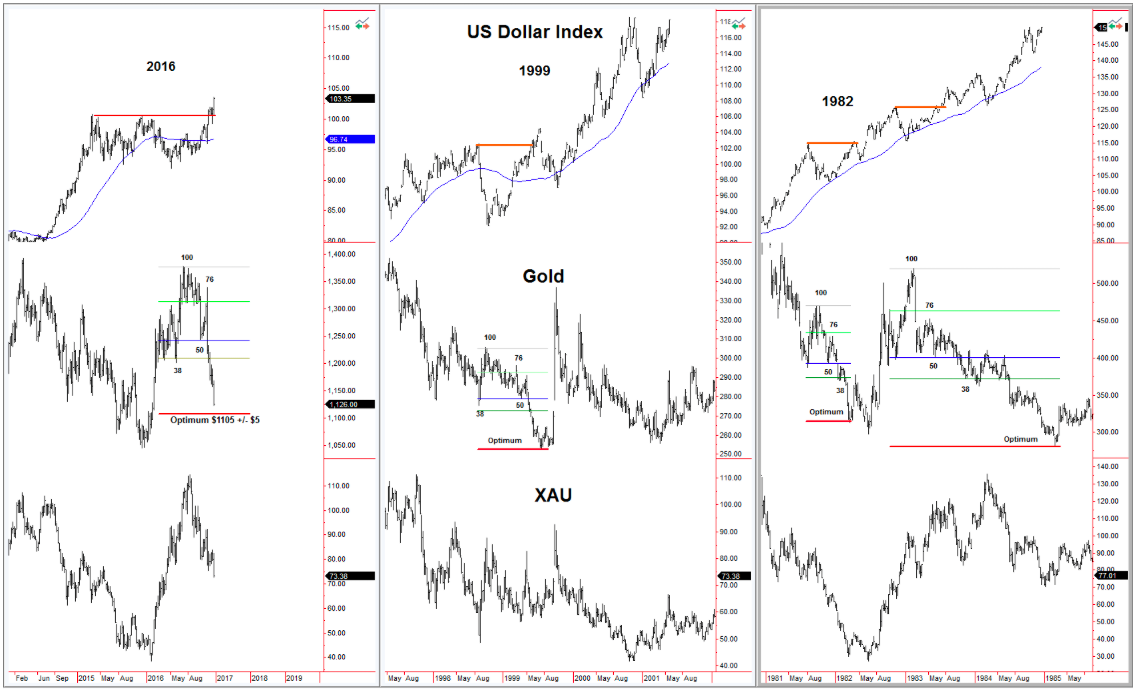

We continue to monitor the seventeen-year cycle in the US Dollar Index and its relationship with gold. Looking at gold since the Dollar bottomed in May, the patterns of 1999, 1982 and 1983-85 are a close match. The Fibonacci levels come into play in each instance.
The October 7th low at $1242 (labelled level 50 on the chart) was the last support before gold broke the May 31st low of $1199. It is deemed to become the midpoint of the eventual decline. The resistance level at 76% was a test of the previous support around $1310 during the summer. April and May become the 38% level in the pattern. The measured range for the downside move is $1105 +/- $5.