

In Elliott wave terms, bond investors have transitioned from extreme optimism to extreme pessimism
[Ed Note: The text version of the story is below.]
What a rout in the bond market in November (Bloomberg, Dec. 1):
Global Bonds Suffer Worst Monthly Meltdown as $1.7 Trillion Lost
The price of U.S. Treasuries nosedived as 10-year yields – a.k.a., interest rates, which move inversely to bond prices — saw their steepest climb since November 2009.
Bloomberg (Dec. 1) provides another perspective:
The 30-year-old bull market in bonds looks to be ending with a bang. The Bloomberg Barclays Global Aggregate Total Return Index lost 4 percent in November, the deepest slump since the gauge’s inception in 1990. Treasuries extended declines Dec. 1.
Elliott Wave International subscribers were prepared well ahead of time.
On June 17, well before the rout, The Elliott Wave Theorist showed this chart and said:
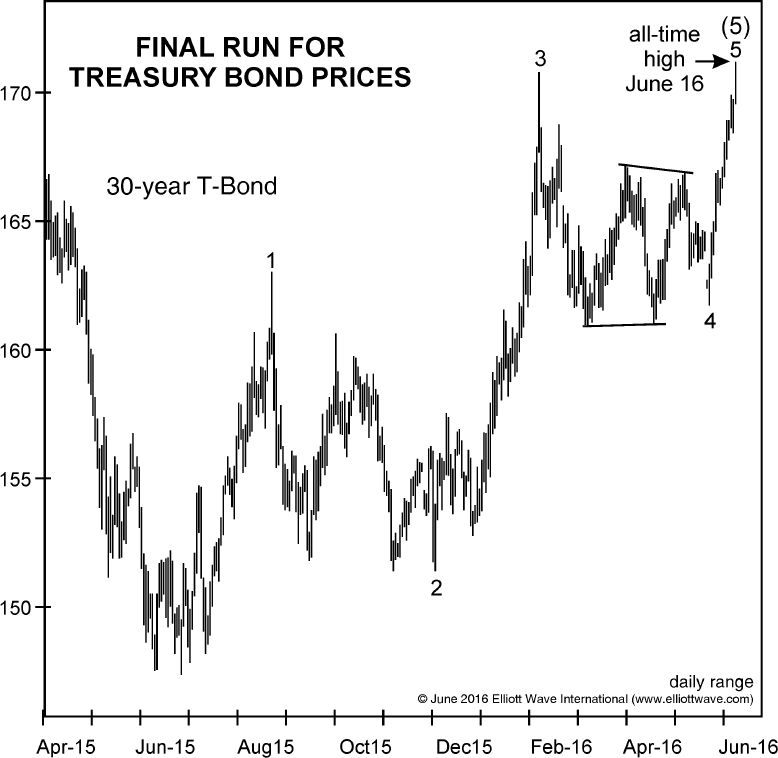
The 30-year Treasury bond made a new all-time high on June 16. The triangle is indicative of a fourth wave, making the recent thrust a fifth wave.
This wave count is terminal. Bonds are on their last leg.
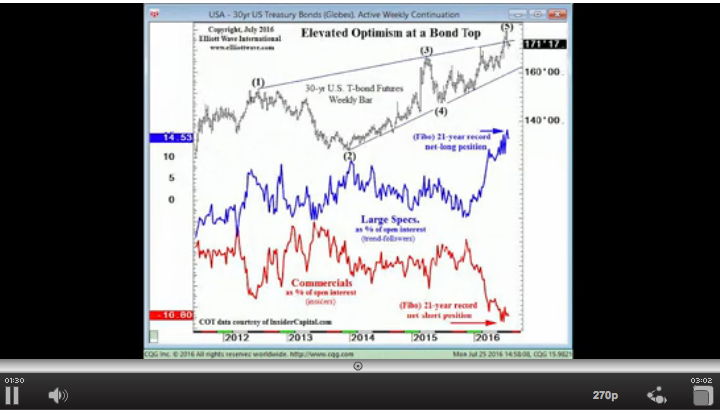
But, at the time, most speculators disagreed. Even so, bond prices topped less than a month later. Said our U.S. Short Term Update on July 25:
The wave structure of the rally ended at the 177^11.0 high on July 11. Sentiment remains historically optimistic. The most recent tally of the Commitment of Traders data shows that Large Speculators (trend-followers) remains a tad off a 21-year record net long extreme in the percentage (of open interest) of bond futures and options contracts they hold. With Commercials taking the opposite side of this trade, the sentiment set up is in place for a continued bond price decline .
Despite the historic optimism, Treasury bond prices continued to decline.
This week, as of Dec. 1, the 30-year yield rose to as high as 3.15%. That’s a 51% climb since the July low of 2.085%.
In other words, in the short term, the market sentiment in bonds has transitioned from a highly elevated optimism four months ago to a deep pessimism we see this week. In fact, the 30-day bond Daily Sentiment Index (trade-futures.com), which our U.S. Short Term Update quotes quite often, is at its lowest level since September 2013 – a contrarian indicator.
Investor psychology could grow even more negative toward bonds. But, keep in mind that countertrend moves in financial markets usually occur when sentiment reaches an extreme like the one we’re seeing now.
Put differently, the 30-year Treasury bond’s price pattern is again looking highly interesting — although, again, in the opposite way most investors expect.