

“There is ABSOLUTELY NO INDICATION yet that we are in a bearish trend poised to break last year’s low in the Dow. Another retest of support – YES.” – Martin Armstrong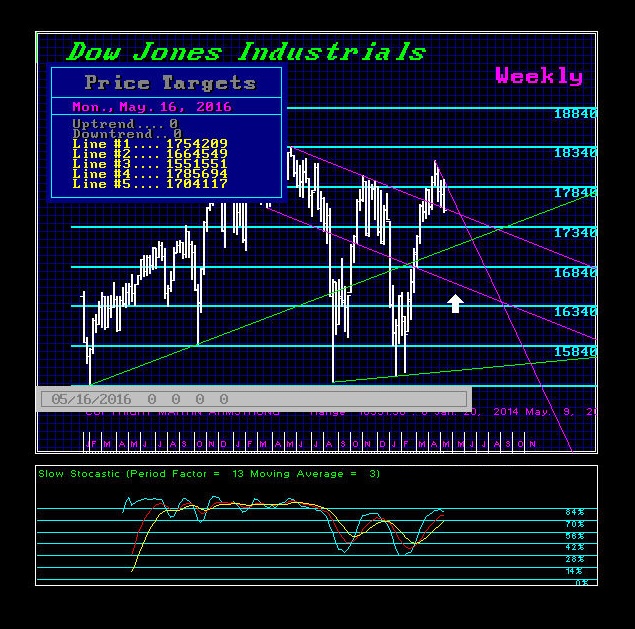
The Dow does not need to break last year’s low, as that was accomplished in the NASDAQ and S&P 500. Nothing has changed there. The entire interest rate issue has far too many people brainwashed. No doubt, they would initially sell. However, the market will rise with higher interest rates as it has always done. Therefore, as shorts build, we can easily create a bear trap and that will be the fuel to rally again. This is the churning we are in until it appears at least after September.
This time, we have a far more serious problem with where to put money – big money. Stocks are the modern-day version of what gold used to be decades ago when you could jump on a plane with a suitcase full of gold and sell it wherever you landed. Today, metal detectors prevent that from taking place. Stocks are being used to move money, but they must be the high-end shares that are traded globally (see article posted on Egypt).
There is ABSOLUTELY NO INDICATION yet that we are in a bearish trend poised to break last year’s low in the Dow. Another retest of support – YES. This is the churning pattern. Breaking last year’s low would ONLY be indicated with a monthly closing beneath 16000 prior to August. Then we are merely extending this entire mess and not altering the long-term outcome.
That said, we have a more important number for month-end at 17579 followed by 17210. A May closing below 17210 would signal a possible test of the 16000 level in the months ahead.
Nevertheless, the first Minor Weekly Bearish Reversal in the Dow lies at 17434, which we flirted with on Thursday. We need a closing below this today to suggest a correction is unfolding. However, make no mistake about it, the next critical area is 17120, which happens to be a Daily and Weekly Bearish Reversal. That is the level to watch for a serious short-term break.
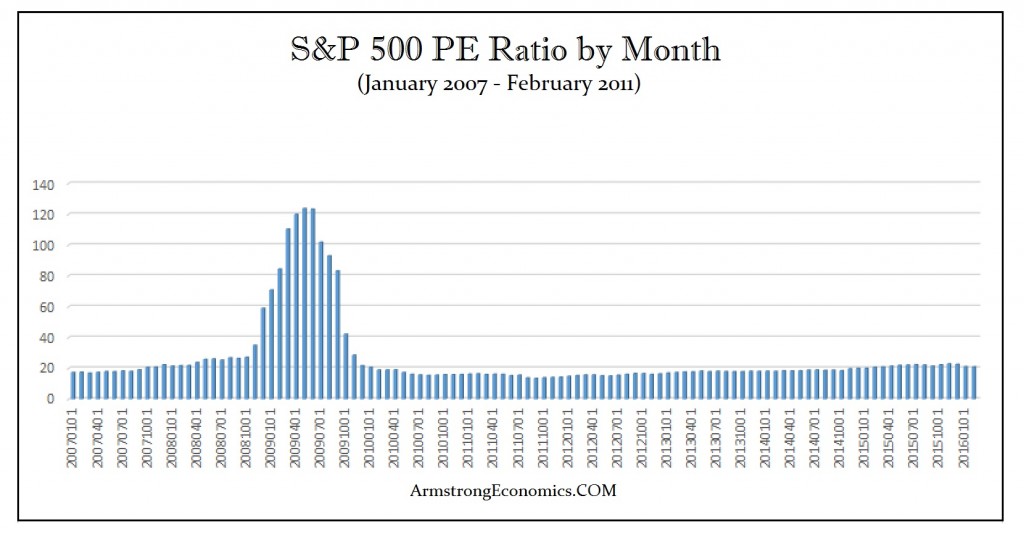
Keep in mind that people continue to think this market is “rich” in price and they are concerned about earnings. Those ideas are so out of touch with reality. The PE Ratioreached 50:1 in 2000 during the DOT.COM bubble, but it exceeded 120:1 during the 2007-2009 meltdown because blue chips are the place to secure money. The market is by no means “rich” from a historical perspective. We are not in some standard investment scenario. A 3% dividend is huge with negative interest rates in cash. Bonds are a disaster and have nowhere to go but down. So how is the market “rich” when there is no other alternative? This is why money has flowed into real estates, ancient coins, metals, and equities. We must look at the alternatives here and the idea of selling stocks must be followed with deciding where to put your cash. Banks or government bonds? Come on. Where’s the rational thinking here?
…more from Martin: Trading Volumes Decline as Hoarding Rises Due to Uncertainty