


The gold to silver price ratio determines the relative value of the two precious metals and is a useful parameter in deciding which metal to buy at any given time (Mercenary Video, March 19, 2016).
In two previous musings, I first documented the history of gold, silver, and the US dollar from the establishment of a national monetary system in 1792 until abandonment of the gold standard in 1971 (Mercenary Musing, April 25, 2016); then price histories and gold-silver ratios from the United States’ abandonment of the gold standard in 1971 to present (Mercenary Musing, May 2, 2016).
In the final installment of this trilogy, let’s revisit the modern-day paradigm and focus on the distribution of gold-silver ratios over the past 45 years.
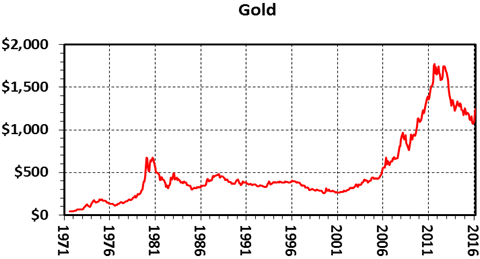
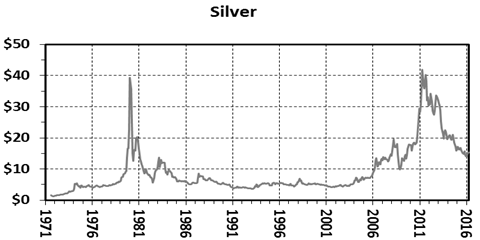
Here again are the monthly average price charts for each metal and gold-silver ratios since August 1971:
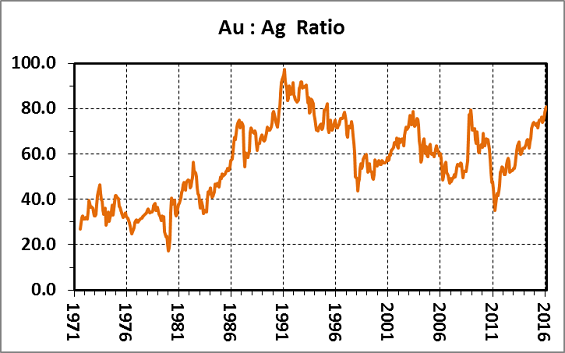
Our data set covers nearly 45 years (537 months). The distribution of ratios follows in both chart and tabular format:

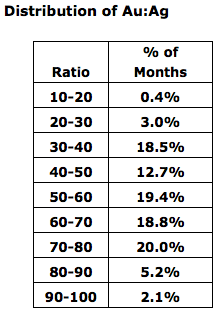
I glean the following from the post-gold standard distribution of gold-silver ratios:
- A ratio of less than 20 is a rare outlier that occurred for only two months in 1980 when both gold and silver went exponential and silver markets were being manipulated by the Hunt Brothers’ speculative attempts to corner worldwide control of the metal.
- Ratios between 20 and 30 are quite unusual at 3.0% of the record. They occurred in the first two months after Nixon did his deed in 1971; for one month in 1974; for eight months in 1976 when gold corrected and silver was flat; and for five months in late 1979 and early 1980 when both metals were in exponential moves up then silver collapsed.
- Ratios from 30 to 40 (18.5%), 50 to 60 (19.4%), 60 to 70 (18.8%), and 70 to 80 (20.0%) are common and almost evenly distributed in the price records.
- Paradoxically, the middle increment from 40 to 50 comprises only 12.7% of the total months in our study.
- Ratios from 80 to 90 constitute 5.2% of the record. Almost all occurred during a three-year period from September 1990 to November 1993 when there was an oversupply of silver stocks, industrial demand was down, and prices languished from $3.65 to $5.00 an ounce.
- Other than the three-year period mentioned above, there were only two months, in March 1995 and March 2016, when the monthly average ratio was above 80.
- Ratios greater than 90 make up 2.1% of the record and also happened in that 1990-1993 interval. The ratio averaged over 97 in February 1991, a value that was exceeded only in 1939 at the end of the depression and beginning of World War II.
Our documentation of ratios since August 1971 debunks the propaganda that comes from hard-core silver bugs about the metal’s relative value to gold.
From a compendium of sources, the average abundance of gold in Earth’s crust is about 4 ppb while silver is about 70 ppb, for a ratio of 1:17.5. Based on these crustal abundances, silver perma-bulls promote a platform that gold-silver ratios should be less than 20.
Their argument is also based on historic gold-silver ratios from late 1792 to 1890 when there was bimetallic backing of the US dollar and/or attempts to control silver prices with coinage legislation, and a two-month period during the parabolic top of precious metals prices in early 1980.
Ergo say they, the price of silver is constantly manipulated, silver is woefully undervalued, and it is always on the verge of a major breakout.
However, silver aficionados ignore important facts regarding supplies, demand, and uses of the two radically different metals:
- Silver is mostly used as an industrial metal (54%); much of that yearly demand is consumed and a relatively minor amount is recycled.
- Gold is a precious metal; 90% is used in jewelry and investments and 10% in industrial applications.
- An estimated 98% of all the gold ever mined in the world remains available and held in jewelry, by central banks, in private hoards, and as fabricated products (source: USGS).
- Cumulative historic world production of silver and gold is estimated from various sources to be about 9.2:1 (1,690,000 tonnes versus 182,000 tonnes).
- For the past 11 years, the ratio of silver to gold mined is about the same at 9.0:1 (258,000 tonnes versus 28,600 tonnes from 2005-2015).
- About 70% of new silver is a by-product from base metal or gold mines; therefore, silver production is largely dependent on the prices of these primary metals.
I conclude that since August 1971 when gold was partially freed from the US dollar on world exchanges, Earth’s crustal abundances, historic fixed-price relationships, and mine production have had no influence on the gold-silver ratio.
Instead, the relative prices of gold and silver are driven by:
- Industrial demand for silver and the vast amount of available above-ground stocks of silver held by hoarders and speculators.
- The health of the world economy and geopolitical events.
- Central bank transactions and safe haven hoarding of gold.
- Speculative traders moving in and out of physical and paper markets of both metals.
In my opinion, gold is the only real money, and it is my safe haven and insurance policy against financial calamity.
Although silver functions mainly as an industrial metal, it is strongly tied to the price of gold and is generally more volatile during upside and downside moves of the yellow metal. In times of financial distress and economic calamity, silver tends to behave more like a precious metal with widespread hoarding of gold trickling down. For this reason, it is often called the “poor man’s gold”.
The gold-silver ratio lends valuable guidance to ascertain whether one metal is over- or undervalued with respect to the other. The rarity of a daily gold-silver ratio above 80 is evidence that silver is severely undervalued and is a strong buy signal for the metal.
My fundamental idea is to buy silver during instances of very high ratios and then trade most of it for gold when the ratio corrects and reverses to the other side. I suggest that a range of 40 to 50 is apropos. Note however, that mark-ups to buy or sell silver are always substantially higher than for gold and the additional cost becomes a factor in the evaluation process.
I strive to have 10-20% of my net worth in physical bullion, mostly in gold but always a portion in platinum and silver.
As a hoarder, my basic strategy for accumulating gold is to buy during downticks in its price regardless of a bull or bear market cycle. In a previous musing, I showed that there is seasonality to the gold price and that the best time to buy is from mid-June to mid-August of any given year (Mercenary Musing, January 4, 2016).
That folks, is the way I see it.
And the way I do it.
Ciao for now,
Mickey Fulp
Be sure to read Eight “New Normal” Charts That Are Insanely Abnormal–and Dangerous M/T Ed