
Wednesday April 6, 2016 3:00 Pacific.
DOW + 113 on 1450 net advances
NASDAQ COMP + 77 on 1050 net advances
SHORT TERM TREND Bearish
INTERMEDIATE TERM TREND Bearish
STOCKS: A rebound in the price of oil helped the energy sector and the FOMC minutes from the last Fed meeting suggested a more uniformly dovish mentality on the part of members than previously thought.
Of course, after a couple of days in a row on the downside, we were probably due for a bounce anyway.
GOLD: Gold was down $6. A rise in rates was most likely the reason along with profit taking from yesterday’s move.
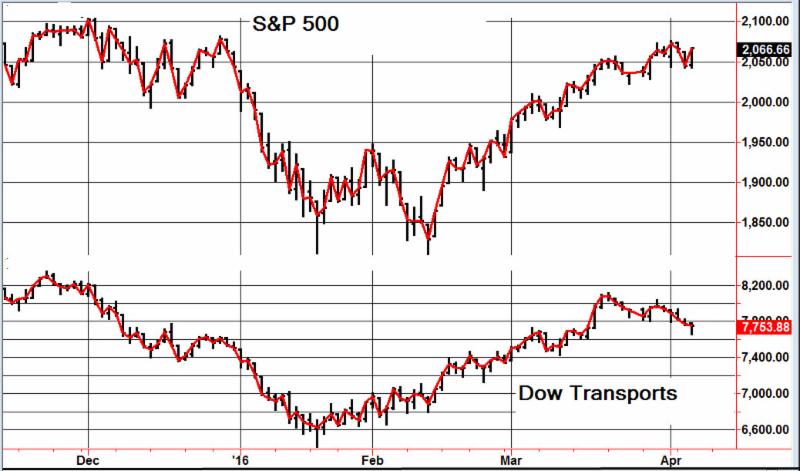
CHART: The S&P made up most of the past two day’s decline, but the advance decline line and the transports did not.
In spite of the action on Wednesday, we still feel that we’re making a short term top. A new high by the S&P would put a dent in that thesis.

BOTTOM LINE: (Trading)
Our intermediate term system is on a sell.
System 7 We are in cash. Stay there for now.
System 8 We are in cash. Stay there.
GOLD We are in cash. Stay there.
News and fundamentals: There are no important economic releases on Wednesday. On Thursday we get weekly employment claims.
Interesting Stuff: We complain that our days are few and act as if there is no end to them. —–Seneca
TORONTO EXCHAN GE: Toronto was up 43.
BONDS: Bonds had a pullback.
THE REST: The dollar was lower. Silver was lower, but crude oil rebounded sharply on the inventory numbers.
Bonds –Bullish as of March 23.
U.S. dollar – Bearish as of March 7.
Euro — Bullish as of March 7
Gold —-Bearish as of March 14.
Silver—- Bearish as of February 22.
Crude oil —- Bearish as of April 4.
Toronto Stock Exchange—- Bullish from January 22.
S&P\ TSX Venture Fund — Bullish from January 29.
We are on a long term buy signal for the markets of the U.S., Canada, Britain, Germany and France.
| Wed. | Thu. | Fri. | Mon. | Tue. | Wed. | Evaluation | |
| Monetary conditions | 0 | 0 | 0 | 0 | 0 | 0 | 0 |
| 5 day RSI S&P 500 | 81 | 72 | 80 | 67 | 41 | 61 | 0 |
| 5 day RSI NASDAQ | 79 | 79 | 85 | 71 | 49 | 69 | 0 |
|
McCl-
lAN OSC.
|
+80 | +70 | + 33 | -51 | -116 | -44 |
0
|
| Composite Gauge | 8 | 10 | 9 | 14 | 17 | 6 | 0 |
| Comp. Gauge, 5 day m.a. | 10.0 | 8.6 | 8.4 | 9.0 | 11.6 | 11.2 | 0 |
| CBOE Put Call Ratio | 1.12 | 1.14 | .95 | .96 | 1.13 | 1.00 |
+
|
| VIX | 13.56 | 13.95 | 13.10 | 14.12 | 15.42 | 14.09 | |
| VIX % change | -2 | +3 | – 6 | +8 | +9 | -9 | – |
| VIX % change 5 day m.a. | -0.8 | -1.2 | -2.2 | -1.2 | +2.4 | +1.0 | 0 |
| Adv – Dec 3 day m.a. | +927 | +883 | +273 | -503 | -968 | -412 | + |
| Supply Demand 5 day m.a. | .60 | .61 | .51 | .48 | .23 | .42 | + |
| Trading Index (TRIN) | .84 | 1.18 | 1.08 | 1.04 | 1.05 | .86 |
0
|
|
S&P 500
|
2064 | 2060 | 2073 | 2066 | 2045 | 2067 | Plurality +2 |
INDICATOR PARAMETERS
Monetary conditions (+2 means the Fed is actively dropping rates; +1 means a bias toward easing. 0 means neutral, -1 means a bias toward tightening, -2 means actively raising rates). RSI (30 or below is oversold, 80 or above is overbought). McClellan Oscillator ( minus 100 is oversold. Plus 100 is overbought). Composite Gauge (5 or below is negative, 13 or above is positive). Composite Gauge five day m.a. (8.0 or below is overbought. 13.0 or above is oversold). CBOE Put Call Ratio ( .80 or below is a negative. 1.00 or above is a positive). Volatility Index, VIX (low teens bearish, high twenties bullish), VIX % single day change. + 5 or greater bullish. -5 or less, bearish. VIX % change 5 day m.a. +3.0 or above bullish, -3.0 or below, bearish. Advances minus declines three day m.a.( +500 is bearish. – 500 is bullish). Supply Demand 5 day m.a. (.45 or below is a positive. .80 or above is a negative). Trading Index (TRIN) 1.40 or above bullish. No level for bearish.
No guarantees are made. Traders can and do lose money. The publisher may take positions in recommended securities.